Performance Debugging
With DevTools
You can also watch this talk online
Me
- 🐦 Twitter: @umaar
- 📧 Dev Tips: umaar.com/dev-tips
- 💷 Course: ModernDevTools.com
This talk:
- ✅ Uses Canary
- 🆕 Enables experimental features
- 👀 Has lots of live demos!
What will we cover?
- 🌍 Network Performance
- 📺 Render Performance
- 👩🏻💻Programmatic Performance
Network Performance
Fonts + Local Overrides
Hello online viewer! The part of the talk was a live demo on local overrides. This video explains all
What did we just see?
- 🖼 Screenshots in the network panel
- ✨ Local overrides + Pretty printing
- 📖 Font display
Render Performance
Performance 🚀
Was traditionally all in the network
But
Heavy frontend?
Then say hello to
👋 Render Performance 👋
Fortunately, we have
Tooling
These tools can turn something
qualitative 👌
Into something
quantitative 🔢
🐢🐢 "It feels sluggish" 🐢🐢
DevTools can help you
quantify
the performance of your webpage
Page Smoothness
With the FPS Meter
JavaScript Execution Cost
Line Level Profiling with three.js
Hello online viewer! This was a live demo of line-level profiling
Breaking Rules
Console Violations
DevTools Audits
Find out:
- Why the audit is important?
- How to pass the audit
- How the audit is implemented
Shareable Audits
A two Minute Performance Workflow
Hello online viewer! This live demo showcased a few bits and pieces. See it at the 17m 35s mark.
Or see lesson 7 of Modern DevToolsRequest Blocking is a thing!
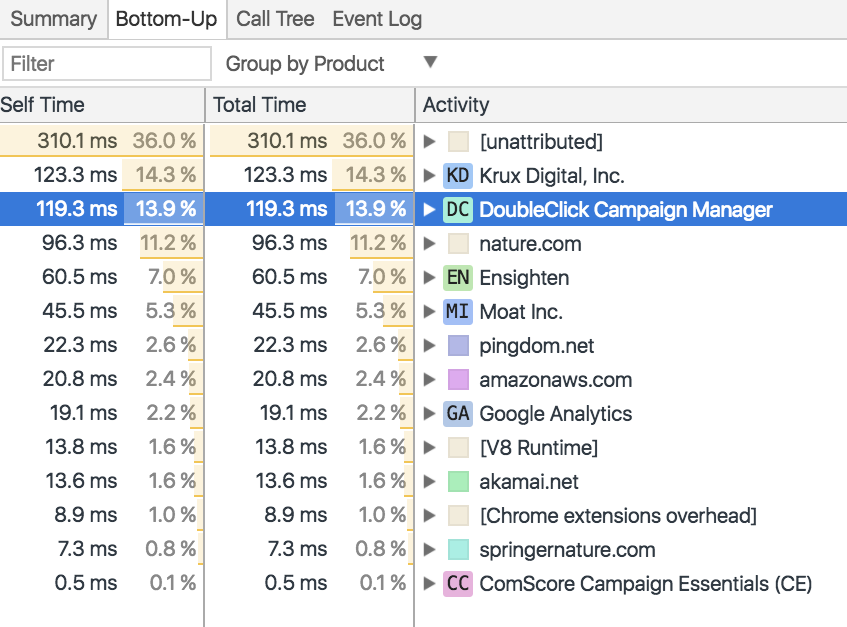
Workflow Recap:
📽 Record perf profile #1
🚫 Block a script (product) in the Network Panel
📽 Record perf profile #2
📊 Compare recording #1 with #2
Find Third Party Scripts
Product Badges
Performance Monitor
Hello online viewer! This part of the demo showed the performance monitor
Performance Monitor - Why?
- Quicker + simpler introduction to render performance
- Capture metrics throughout your complete website usage
- Drill down into only what you care about - remove the noise
Programmatic Performance
Paint Indicators
Hello online viewer! The part of the demo showed off paint indicators @ 25m 16s.
performance.getEntriesByType('paint')
Identify Unused CSS & JS
Hello online viewer! This part of the talk showed off code coverage
Code Coverage Features
- 👁 Visualise your unused CSS & JS
- ♻ Real-time updates
Programmatic
Code Coverage
Hello online viewer! This part of the talk showed off using puppeteer to extract code coverage information. You can view and run the code here on GitHub
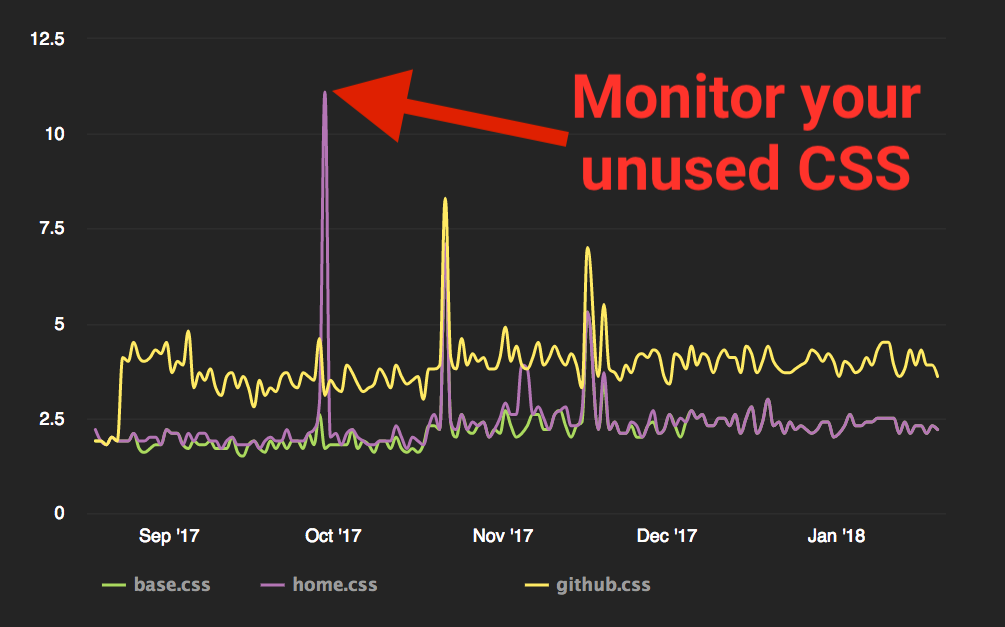
Monitoring your unused CSS over time?
Recap
Thank you
-
Course Website - ModernDevtools.com
-
DevTools tips and tricks in your inbox - umaar.com/dev-tips
-
Twitter - @umaar